The long view is simply about gaining some perspective as the market whip back and forth in a very extended market topping process. It is about understanding that the markets for all their ups and down have really gone nowhere the last two years. And that a new high for the SP500 does not mean we are at the start of a new bull market. New bull markets do not start at the highest medium price-to-earnings and price-to-revenue levels since 1929. The real question is how is the greatest global monetary experiment in history going to end. But for today we are just going to look at a few simple charts.
In the first chart we see the relative performance of the TSP funds since May 11, 2015 when our SP500 model signaled the start of the annual *unfavorable* season for equities. The equity indexes have basically gone nowhere since that time if you overlook the roller coaster ride. The TSP I fund which tracks the MSCI EAFE index (developed world minus US & China) did not bounced back this Spring which is somewhat surprising since it is Europe and Japan that have taken over the central banker’s QE give-away.

We also note that the TSP F fund’s out-performance began at the very end of 2015 just prior to the most recent equity market swoon. A bump in the fixed income fund is not unusual during market corrections as funds flow from stocks into safer bond funds. What is a bit unusual is the current simultaneous rally in stocks and bonds which I attribute to expectations of significant new central bank stimulus. The question for the equity markets is what happens next when *expected* stimulus is priced into the markets if the fundamentals do not improve drastically or if the developing banking crisis in Europe is not resolved?

We can see what happened the last time we went through a global banking crisis – during the 2008 presidential election year. Back then, we did not have hyper-active central bankers with so many new “monetary tools” always hitting their panic button just prior to investors hitting their panic buttons. So now bear market rallies are so impressive they can even cause the SP500 to hit new highs. Yes, the SP500 just hit an all-time high but I am sticking with my bear market call and two year expectation of much lower equity levels.
In the chart above we see the non-sp500 small cap fund (blue plot: TSP S fund and VXF ETF) had the best peak-to-peak performance, but many may be surprised that the number two fund was not the SP500 index. The second best performance since the last market peak was the Barclays US Aggregate Bond Index fund (TSP F fund and AGG ETF). As my members are aware, I have been negative on the MSCI EAFE (TSP I fund) for some time and did not even bother to develop a timing model for it. This developed world stock market sans the US is trading below its level nine years ago. For now, I’ll stick with the funds priced in the world’s reserve currency – US index funds.
It might also be surprising to some to learn that without the Spring rally, the SP500 index would have fallen behind the lowly TSP G fund. If you are going to buy and hold, why bother with the stressful ups & downs of the SP500 when you can sit worry-free in the TSP G fund which hits a new all-time high every single day!
And I can not think of a better time to switch to the lowly G fund or any other short-duration treasury fund than near the top of the current bull market because we can see what is going to happen to these two funds relative performance sometime in the near future by simply looking at what happened in 2009. Yes, the TSP G fund and Barclay’s Aggregate funds outperformed SP500 index funds by 60% in a little over a year back then.
Better yet, if you follow the greatest investment strategy ever conceived – the Hindsight is 20/20 Strategy – you would sit in the TSP G fund or another low-risk fund during the bear market and then jump back into the best performing equity fund at the start of the new bull market (of course missing any deep market corrections along the way). Sorry, I do not know of anyone offering the Hindsight Strategy in advance but I did back-test it in developing our current strategy.
In the chart below, I added our Advantage S model designed for the small cap funds. Within the “Bear Market & Bounce” box we see that by simply sitting out the unfavorable season for equities you would have basically broke-even during the bear market which is a bit better than losing half your funds. I point this out, because we are rapidly approaching the worst time frame within the unfavorable season for equities and for whatever reason, the markets like to have accidents during this time.

You will also note that our Advantage S timing model (TSP S fund and VXF ETF) has been tracking the steady performance of TSP G fund since May of 2015 (1st chart). If you look within the “Bear Market & Bounce” you will see why. Even our Advantage S model took a hit during the favorable season for equities in 2009 before bouncing back to break-even. It is our desire to avoid these sleep-depriving market swoons and also re-enter the market closer to the bear market bottom. So we patiently wait and do not give up our very low tolerance for risk especially since it does not require settling for lower returns in the *long run* – quite contrary. In short runs, sometimes yes.
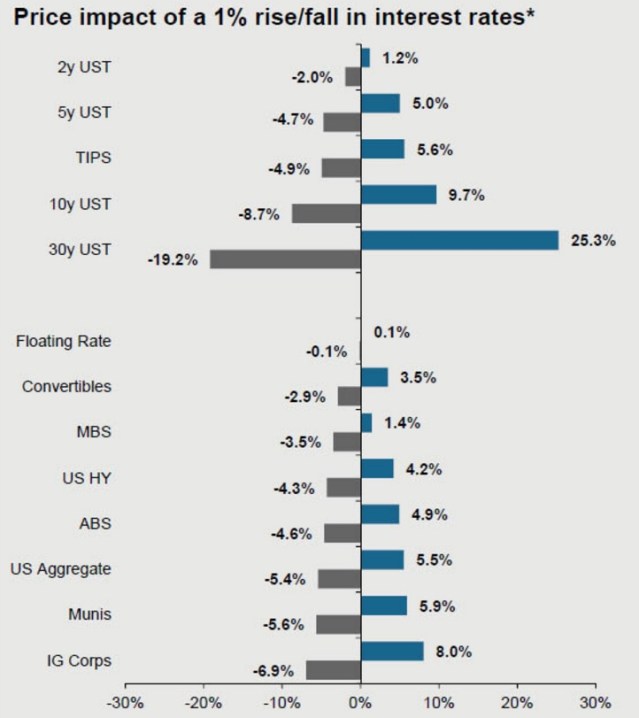
As for fixed income funds, you can use the next chart to pick the levels of losses you want to obtain once interest rates finally bottom and start rising again. The chart shows the capital gains or losses to expect for each 1% move in interest rates based on the effective duration of the fund’s securities. It is not precise, but close. Generally speaking, bonds with a longer duration see greater price swings.
My oft-repeated advice is that when it comes to fixed income/bonds, past performance can not be used to judge future returns. This is not just due to capital gains and losses. It was not many years ago the US Aggregate Bond fund yielded over 6% – today it is under 2%. Once interest rates stop falling, investors will be left with paltry yields.
So if you based your decision on past returns you might jump into the 30 year treasuries since the recent trend is lower interest rates. I am not sure all investors understand they are speculating interest rates will not move up. Note: The interest rates of different duration do not move at the same rates and sometimes they do not in the same direction.
The “US Aggregate” is the same as the Barclays US Aggregate Fixed Income Fund (TSP F fund or AGG ETF) in the charts seen above. It’s average duration is 5.4 years thus we see its price moves approximately 5.4% in the opposite direction of interest rates. Since the fund’s inception, interest rates have been trending down and this explains its out performance to the TSP G fund which records no capital gains or losses as interest rates move.
With the dive to negative interest rates, it is possible the US 30-year interest rate could decline another 1% and see capital gains of 25% during that time. Just realize at some point the fire exists could be blocked if everyone decides the game is up. With interest rates hitting all-time lows (see the bottom chart) investors could also be picking their poison for when interest rates bottom and start to rise again.
I often comment on the “extreme” monetary policies of the day. The effects of our current hyper-active central bankers can be seen below. We are now in uncharted territory in the US in terms of the lowest interest rates on the longer term treasuries, not to mention the negative interest rates seen in Europe and Japan. If the SP500 hit a new high with interest rates half way normalized, I might struggle with the bull/bear market call. But until interest rates are able to steadily move back up toward 2% without sending the stock market into a tailspin, we are in bear country. And unlike previous bear markets, this one may include both bonds and stocks before it is over.

Yes, interest rates can move lower and the equity markets can become even more over-valued, but low-risk investors should leave the risk-surfing bubble-chasing to speculators. I also strongly advise against shorting this market because the central bankers are reacting to the same market signals as traditional market analyst do in their efforts to maintain “financial stability” which leads to rip-roaring short covering rallies.
You are welcome to follow our market commentary, or follow our low-risk semi-passive timing strategy by becoming a member of TSP & Vanguard Smart Investor – and you do *not* need to have a TSP or Vanguard account. Our service is suited for those who prefer to invest semi-passively in index funds but want downside protection. Or want to track cyclical indicators for bull/bear market cycles. Or for those interested in adding our seasonal almanacs to their investor tool kit. Simply choose the level of service that suits you and invest smart.
Categories: Perspectives, TSP Allocation Strategy, TSP Charts