I don’t normally talk about individual stocks, but sometimes we find an example and lesson for the broader market in individual companies.
The saying in the 50’s was actually “as GM goes, so goes the nation” but GM went bankrupt in 2009 and its stock became worthless. GM’s management paid off its workers healthcare fund’s large deficit with its stock instead of cash just prior to it becoming worthless – nice move.
It was not easy finding a chart of GM prior to its bailout – this one ends before hitting bottom. Note that at the 2000 bubble top GM hit $93 a share, nine years later it was worthless.

So what does the other “G” tell us about the nation today?
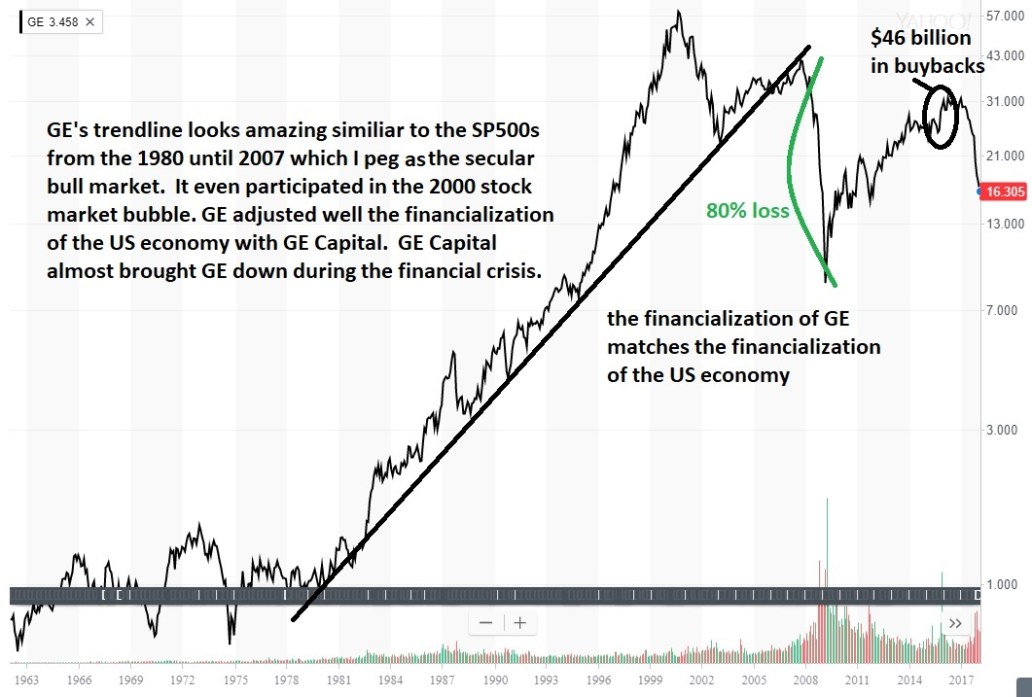
I have a slightly different angle on the saying. I would say today as GE goes (and GM before it) so goes mainstreet America. But in a different way than you might think. Some see it in terms of the decline in America’s manufacturing base. I see it from the financialization angle.
Bloomberg estimated GE’s pension fund is short $33 billion dollars and is the biggest shortfall in the SP500 by far. So what did GE’s outgoing CEO Immelt do in 2015 and 2016. Did he shore up the pension fund that half a million families depend on? Of course not – he bought back $46 billion in corporate shares to “boost share price to $45” and of course his compensation before he left.
How did that turn out for GE’s stock price all said and done… down 50% and counting since the buybacks.
But it gets worse. That $33 billion dollar pension shortfall includes a fund heavy in stocks (57%) with an assumption of a 7.5% returns going forward. I expect the SP500 to have negative returns over the next 12 years which means a massive default on half a million family’s GE retirement plan.
That, my friends, describes the nation and the age we live in. I dub it the age of “Wealth Extraction” and its effects will not be seen until the last half of the current market cycle (and credit cycle) when the over-leveraged US corporations default in mass on their pension plans. It’s baked into the cake and somebody has to eat it. But it will not be the CEOs or the bailout-welfare wall street bank recipients.
As a final irony, consider that Immelt has little to worry about in his own pension. As part of his retirement package, according to corporate disclosures, he’s due personal pension benefits worth nearly $82 million.
GE spent lavishly on shareholders, shortchanged pensions and still landed in a deep hole
GE’s financial engineering is still unraveling – underfunded pensions and now we learn about GE Capital’s underfunded long-term care insurance policies for customers, not employees.
GE also said this week that it would set aside $15 billion in the coming years to pad the reserves on an insurance portfolio largely focused on long-term care policies. The latest disclosures suggest the value of the GE Capital business may be negative, Jeff Sprague, an analyst with Vertical Research Partners, said Friday in a note.
GE is now facing a cash squeeze – remember that $46 billion in stock buybacks.
“Ongoing liquidity pressures and significant remaining GE Capital risks may make an equity capital raise unavoidable,” Inch said. Given the possibility of additional share declines, GE may need to take such action “sooner while its stock is still elevated.”
So Immelt bought GE stocks at $32 a share and now GE needs to issue shares for cash with a price declining through $16 a share. Buy high and sell low. Immelt knew exactly what he was doing – extracting wealth while he could.
GE is not alone. If you remove the top 25 companies in in the SP500 in terms of cash holdings, the leverage ratios of SP500 corporations are high and growing. S&P discusses the situation.
Removing the top 25 cash holders from the equation paints an even more sobering picture. Total debt among the bottom 99% jumped nearly $200 billion to $5.1 trillion last year [2016], while cash rose just $60 billion to $875 billion.
We note that speculative-grade borrowers’ cash-to-debt ratio is at a decade low of 13%–a significant drop from the 21% reached in 2010, and even below the 15% in 2008 during the Great Recession. In other words, after adding $200 billion of debt last year, these borrowers now have almost $8 of debt for every $1 of cash. (We also note that they borrowed significant amounts under extremely favorable terms in a relatively benign credit market without effectively improving their liquidity profiles.)
I’ve seen charts with “net” debt-to-earnings ratios which subtract out the cash holdings of the SP500 which make the situation look better. The problem is half the cash in the SP500 resides in the top few companies so it skews the picture of the broader market.
With low interest rates many companies can handle the interest expense for awhile, but unfortunately too many of them invested in stock buybacks and not enough in investing in future earnings growth.

SP500 leverage today has not only exceeded the 2000 and 2007 market peak levels but also the bear market/recession levels. If you want to understand why Dr. Hussman and others believe the SP500 will trade at less than half of its current price in the future, look to GE as the example.

Categories: Perspectives, The Smart Bird