Since 1995, Sweden’s “inflation” rate has averaged under 2% as seen in the chart below. Please ignore the first chart since we all know housing is not a big part of anyone’s budget.

See, no inflation – okay at least it’s under the arbitrary 2% inflation rate the central banks like to target.

As a matter of fact, the European Central Bank’s (ECB) President Draghi says the ECB must be ‘persistent’ with monetary policy in face of weak inflation. He means persistent at creating money out-of-thin-air and buying and inflating financial assets as a sort of trickle down experiment from wall street types, to corporate types to… well that is about as far as it goes. Unless you count the housing bubble.
But you probably do not live in Sweden, so why do I bring this up. Because it is the same here in the US. The US central bank has been targeting 2% inflation and been use the excuse that consumer “inflation” is too weak to raise interest rates for way too long while financial asset “inflation” has skyrocketed. But let’s not go there yet. Let’s look at inflation in the US.
We must have inflation!
What if consumer prices stop rising? Oh the horror – everyone would stop buying food and beer, or gasoline to get to work, or clothes for their children because they might be able to get it 1 or 2% cheaper next year. If people’s refrigerators break they might wait a year to get it $10 cheaper and slow the economy down.
So the Federal Reserve is trying desperately to get consumer inflation up to 2% to keep the beer flowing and the economy from coming to a grinding halt. So how far off have we been to this critical target?
0.3% for the last 5 years! That’s .003 without the “%” sign. Within 1% for 25 years.

Oh and look, the 2 and 5-year treasuries are paying less than the inflation rate since 2011 – negative real interest rates. We really need to raise interest rates.
So I went looking for that 0.3% to see if I could help…
I think I found it
I found it in “quality adjustments” to the CPI data. I remember hearing about the “quality adjustment” long, long ago when I working on my finance degree. My professor probably spent 5 seconds on it during one class one day. So at least I know that “quality adjustments” have been around a long time.
My view of quality adjustments is that they were incorporated in the days when inflation was running a tad high and some one had the bright idea to target inflation “expectations” along with inflation itself.
There is so much more you can do to fool convince people that inflation is lower than it is and thus help interest rates move lower than the market might otherwise allow. Now the central banks just force them below free-market levels with QE.
It also had the side effect of lowering CPI linked payments such as social security.
I do not like the justifications. By incorporating quality adjustments into the data we move away from measuring actual inflation and into a very subjective quality of life measurement. For example…

Each new version of the standard iphone has been priced near $650. I get that technology is getting better, but are we measuring prices or quality. My budget for phones and computers does *not* go down, it stays about the same over time. Yet this one small sub-component of CPI has been used to subtract 0.1% annually from the overall inflation.

From the BLS point-of-view your new $650 iphone today is 55% less than a new $650 iphone in 2008. Try making a call with 45% of an iphone.
Let’s look at something a little more expensive…
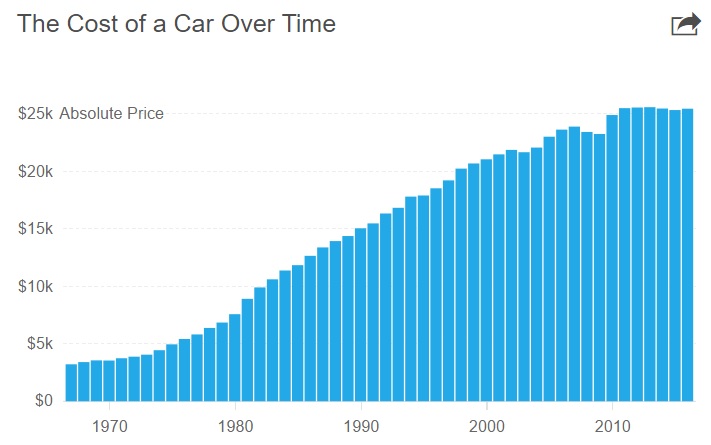
The chart above shows that the average sticker price of a car sold in the US is up 30% since 1997. Sticker prices did level off after the financial crisis. But as far as the CPI data is concerned, new vehicles leveled off in 1997 and were only 2% higher in 2017.
Where did the 28% price inflation go? To quality adjustments that almost perfectly offset and sticker price increases. See no inflation in cars.

Yes, cars are getting better in some ways, but I can’t get to work with 70% of a car. I need to buy a whole car. And yes, you can move down the chain to a used car, but they did the same thing to used car prices – no inflation.
Now if you are in the upper 10%, you will not notice the difference since a thousand here or there is play money. But if you are the 80% and this goes on for 30 years, then you are being squeezed and you don’t know why.
I didn’t need to go looking
I think the Federal Reserve knows they may have a runaway inflation problem – not in consumer prices, but in financial assets. They want to raise rates, but their jerry-rigged inflation numbers are not giving them justification. So the New York Fed quickly created a new measure to provide justification. Meet the Underlying Inflation Gauge (UIG).

The UIG (prices-only) inflation measure is above 2.3% and they claim the UIG (full data set) provides early warning and it is in a steepening climb above 2.8%. So the bond market may be in for a surprise since this data supports faster rate hikes! Hint, hint.
I decided to see how their new measure stacks up to all the current measures. The black line is the UIG price only data and the blue line is that leading inflation indicator.

Since I couldn’t quite eyeball each measures average, I ran the 1995 to 2017 numbers in a spreadsheet and came up with the next table.
Maybe all they did was leave out the quality adjustments because you know what, the UIG Full Data and Price-only data is 0.4% higher than the Fed’s previously favorite trimmed PCE inflation and the GDP price deflator and the social security COLA linked all-items CPI. That sounds about right for “quality” adjustments.

So see, we have this wonderful consumer inflation after all. We had it all along! Better start raising interest rates faster and set that target interest rate level higher to pop all those bubbles in financial assets (stocks, bonds, real estate) to rein in consumer inflation before it gets out of hand. Because…

…we know that 12 trillion dollars of global money creation out-of-thin-air (called QE) all went into the real economy and not into blowing the largest bubble in financial assets of all time…

…and I mean all-time.
Invest safe, invest smart.
About TSP & Vanguard Smart Investor
Categories: Perspectives, The Smart Bird